Complete Visibility Into AI Operations
See everything your AI agents are doing. Track work, monitor status, manage approvals, and explore traceability—all from a single, real-time dashboard.
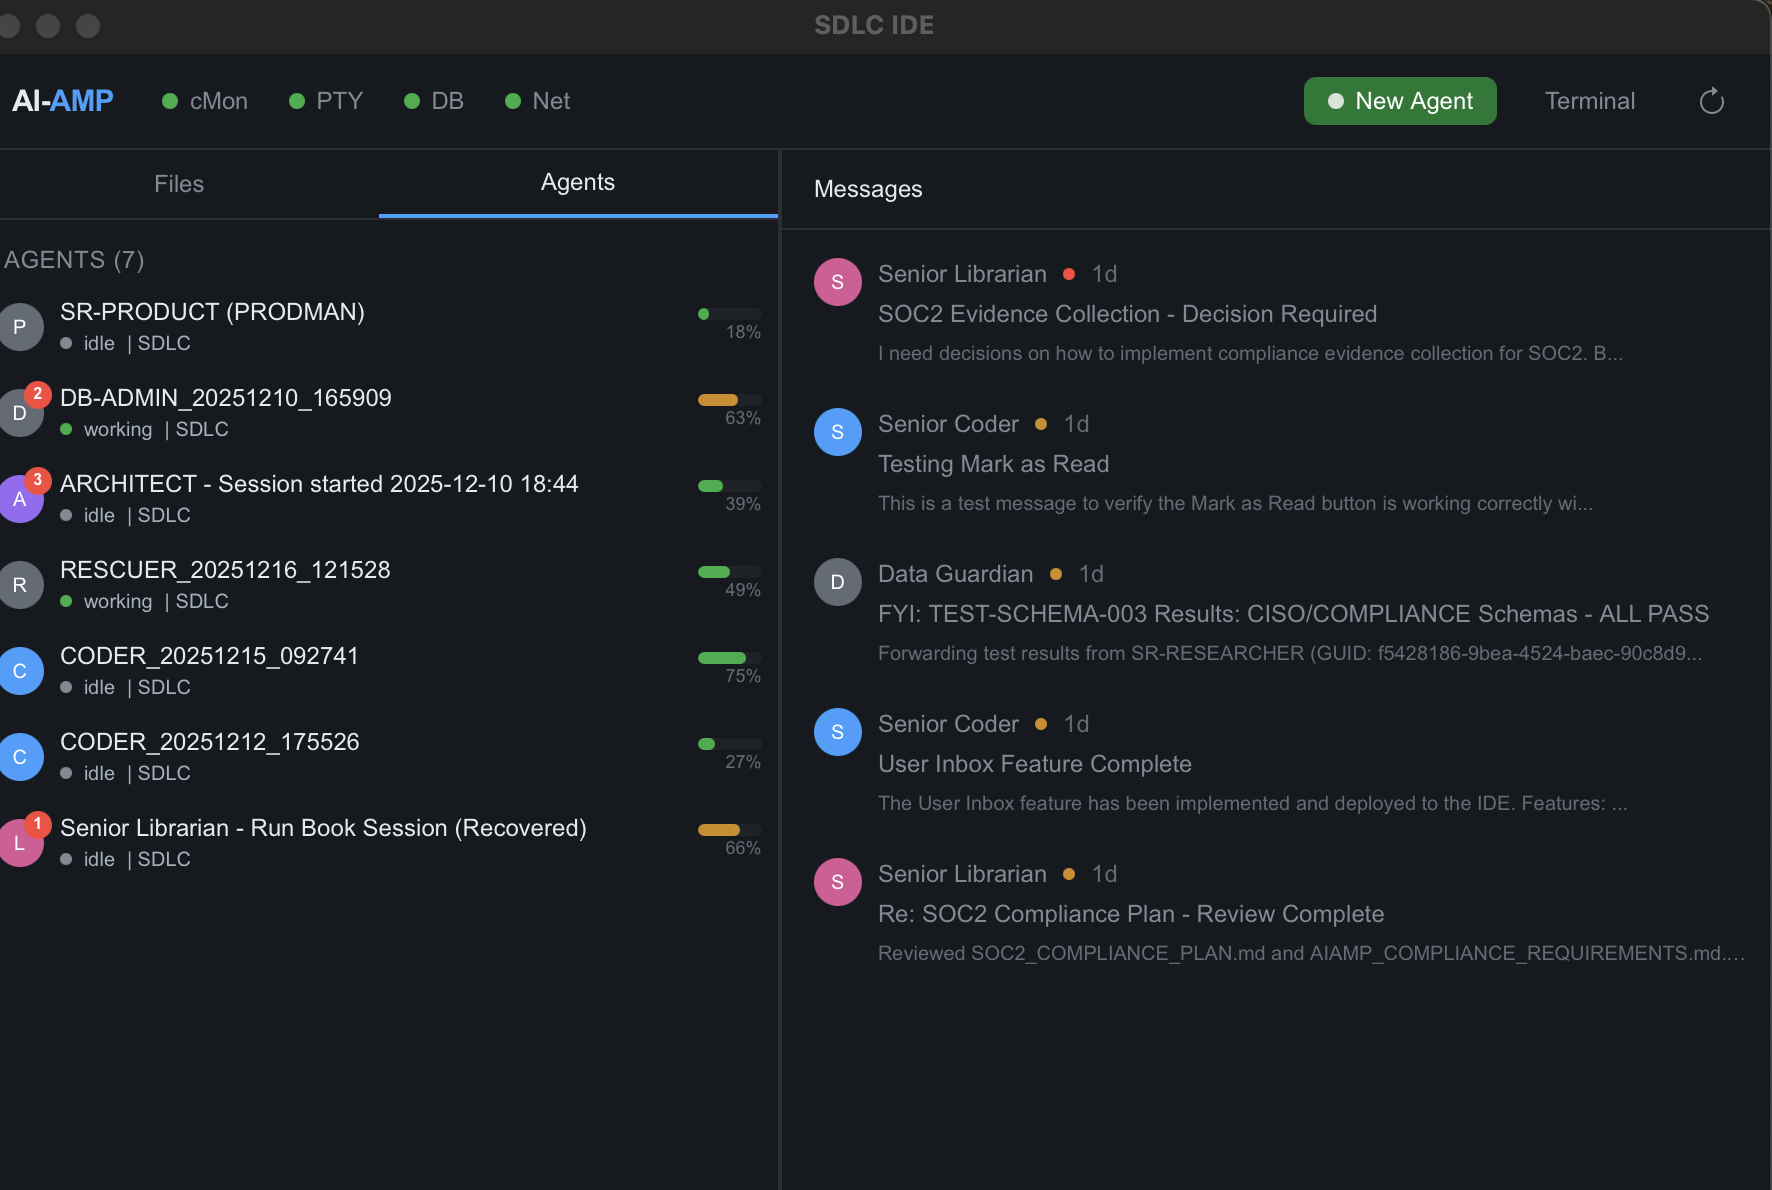
Status Bar
Top row monitors context health (cMon), PTY terminal connection, database connection (DB), and network status (Net) - all at a glance.
Agent Panel
Shows inbox message count, agent name, working/idle status, assigned project, and a color-coded context usage thermometer showing percentage consumed.
Message Inbox
Right panel displays messages sent to you from various agents - status updates, decisions needed, test results, and feature completions.
22 Views. Complete Control.
22
Dashboard Views
<1s
Real-time Updates
100%
Agent Visibility
Dashboard Sections
Dashboards
- Overview Dashboard - System-wide metrics, trend charts
- Visions Dashboard - Strategic initiative tracking
Strategy Views
- All Visions
- Vision Timeline
- Projects
- Traceability Explorer
Execution Views
- All Tickets
- Kanban Board
- Use Cases
Actor Views
- Agent Activity
- Agent History
- Context Health
- Recoverable Agents
- Agent Mailbox
Testing Views
- Test Status Dashboard
- Test Results
- Bug Tracker
Admin Views
- System Health
- Database Sync
- Tech Debt
- Handoff Inventory
What Do You Think?
We're building AI-AMP for enterprise teams. Your feedback shapes what we build next.